Who Lives in the Water?
Students explore diversity and adaptation to aquatic environments by observing aquatic macroinvertebrates using the Virtual Macroinvertebrates Identification Program.
Purpose: To investigate observe and quantify macroinvertebrates through observation and charting.
Summary:
In this exercise, students will, using, the Virtual Macroinvertebrate Program, observe macroinvertebrates. They will record and summarize and interpret their findings.
Background:
Aquatic macroinvertebrates (insects and other organisms that live in streams and ponds) display a wide range of adaptations to different aquatic conditions. Some types of macroinvertebrates are extremely tolerant of changes in temperature,
flow, food, or even the presence of pollutants, while other types are so sensitive to these changes that they may die or move to other areas. In this activity, students identify the macroinvertebrates in a stream using the Virtual
Macroinvertebrate Identification Program noting which types are most abundant.

Materials:
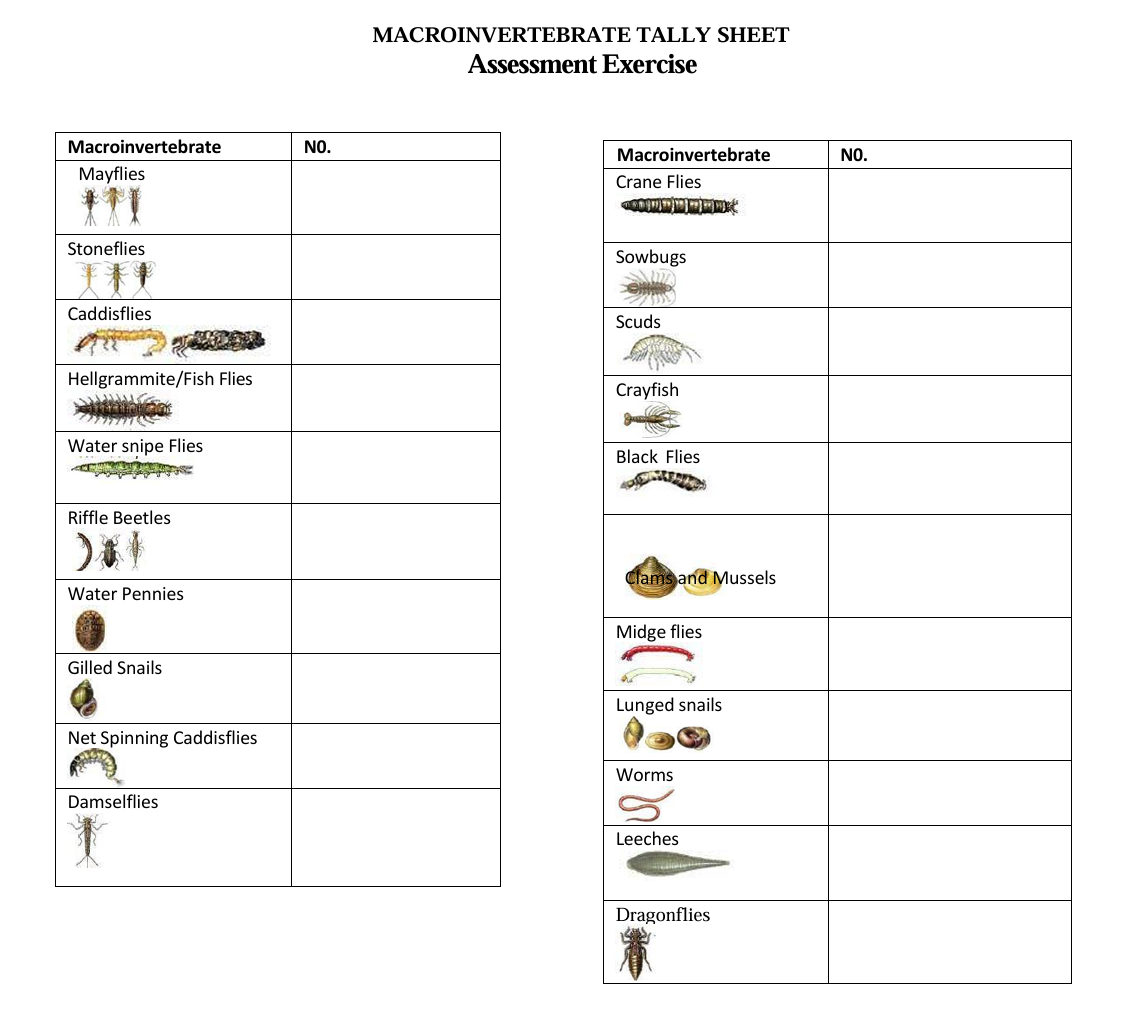
Macroinvertebrate Tally sheet
Macroinvertebrate Pollution Sensitivities
Guide to Macroinvertebrates
Macroinvertebrate Survey and Assessment
Documents: Biological Monitoring, Stream Side Science User’s Manual
Presentations: Biological Monitoring, Who Lives in the Water.
Introduction:
Macroinvertebrates are organisms that have no backbone and are visible to the naked eye. Macroinvertebrates live their lives mostly in the water. All macroinvertebrates start their lives in the water.
Each macroinvertebrate has its own pollution tolerance. The classes of macroinvertebrates are low pollution tolerant, somewhat pollution tolerant, and high pollution tolerant (Primbas, 2005).
Macroinvertebrates that are low pollution tolerant are caddisflies, water pennies, stoneflies, and mayflies.
Somewhat pollution tolerant macroinvertebrates are dragonflies, craneflies, and damselflies.
High pollution tolerant macroinvertebrates are blackflies, aquatic worms, and midges (Primbas, 2005)
Biotic index values of macroinvertebrates can be used to determine the water quality. The Hillsenhoff’s biotic index scale ranges from one to ten.
An average biotic index values ranges from 1 to 3.75 the water quality is considered excellent.
An average biotic index values from 3.76 to 5 infer good water quality
An average biotic index values from 5.1 to 6.5 infer fair water quality
An average biotic index values from 6.6 to 10.9 infer poor water quality. (Faulds, Murray, & Neville, n.d.)
Macroinvertebrates have different preferred habitats based on the water quality they need to survive:
Riffles
Stagnant
Pools
Undercut Banks
The anatomy of a stream includes habitats such as riffles, undercut banks, and stagnant pools.
Riffles are fast moving white water with a rocky bottom that is not too deep.
Undercut banks are slow moving deep waters that flow under the edge of the stream bank. This habitat has an overhang of vegetation. When vegetation falls into the stream, it is washed downstream into stagnant pools where it stays and decomposes. (Allan, 1995).
Macroinvertebrates have different preferred habitats based on the water quality they need to survive. Many macroinvertebrates prefer or need a high dissolved oxygen level.
Many macroinvertebrates also prefer to live where the temperature is cold and the current is fast, some macroinvertebrates need or prefer warmer temperatures with less dissolved oxygen.
Macroinvertebrates such as leeches and aquatic worms are very tolerant to pollution and they do not need high dissolved oxygen levels
Student Activities
Assessment
Directions
Identify the aquatic macroinvertebrates in the Who Lives in the Water exercise presentation.
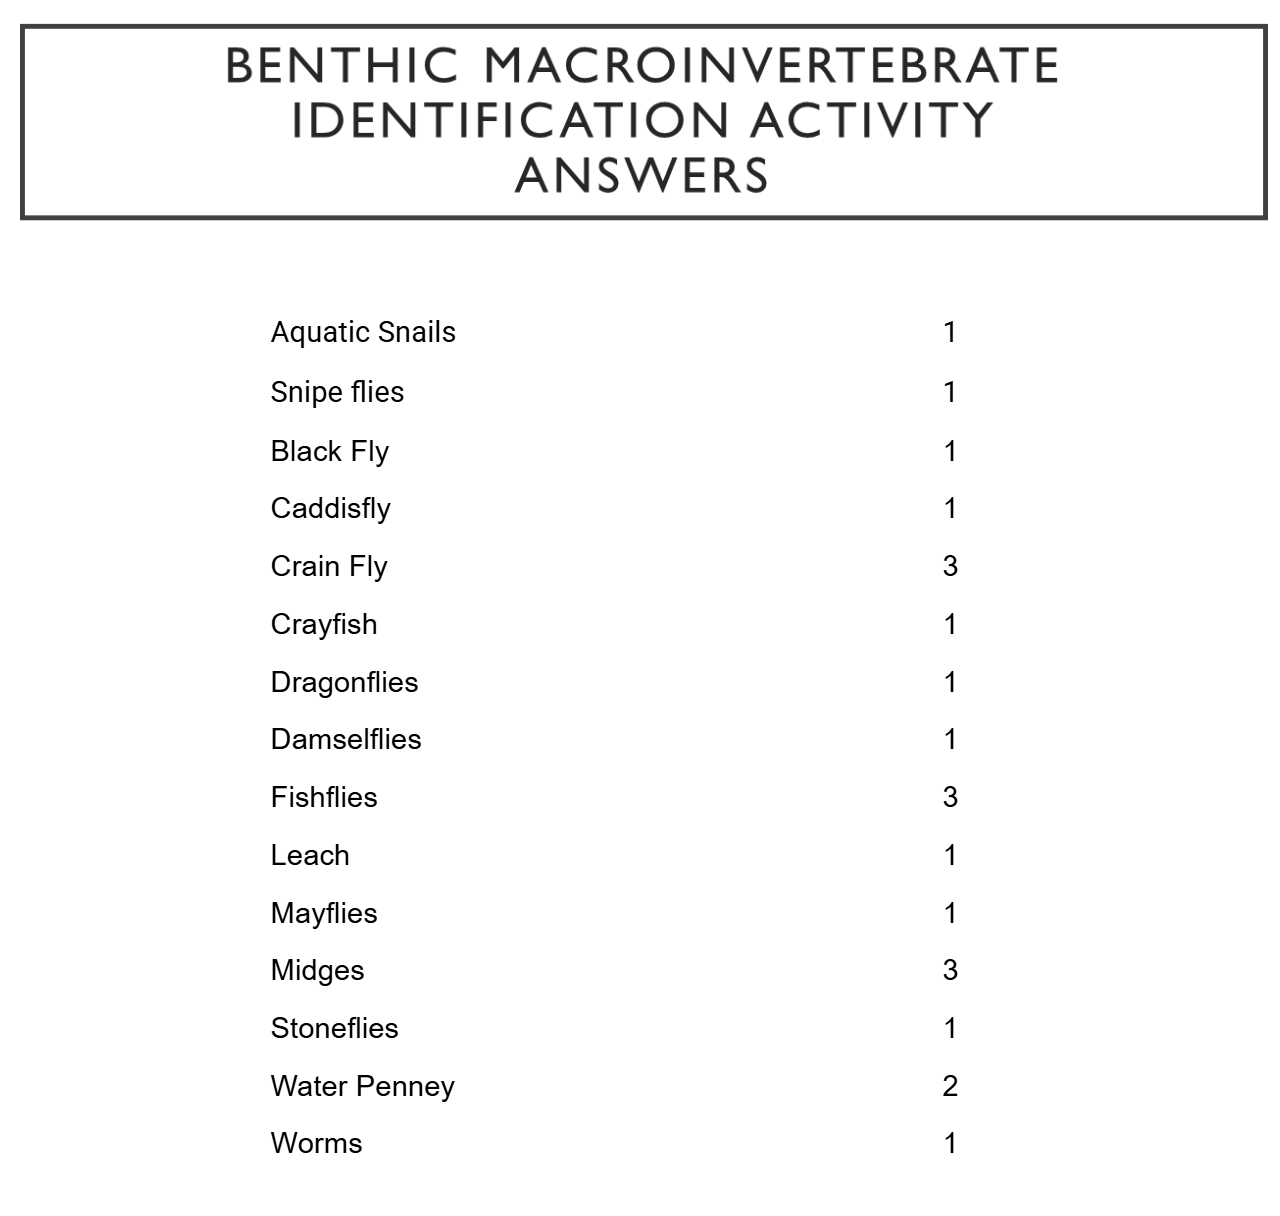
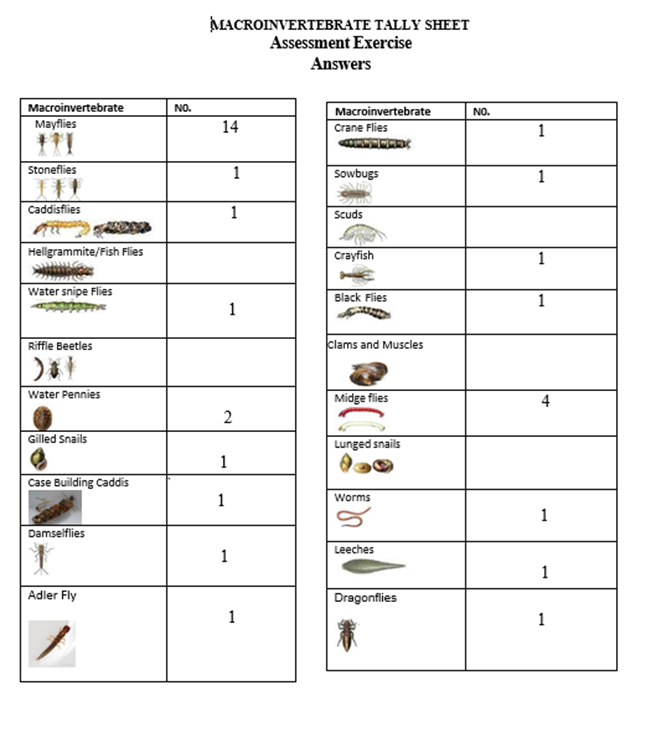
Using the Macroinvertebrate Tally Sheet, identify the species and the number of organisms present.
Use the Biological Monitoring Data Assessment Sheet to record the presence and abundance of macroinvertebrate to assess the overall water quality.
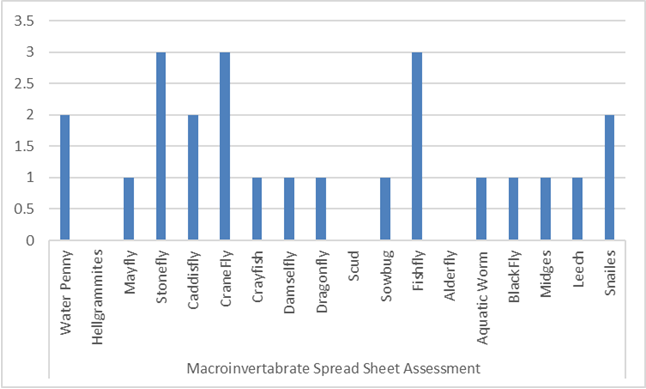
Develop graphs using the date to allow for visualization of the data.
Macroinvertebrate Graphing Activity
PURPOSE: To describe and identify the quality of a stream site by analyzing the aquatic macroinvertebrates that live there.
SUMMARY: Students will learn about water quality indicators through the use of candy representing a “macroinvertebrate sample.” Sorting the candy and evaluating what is found will tell the students about the quality of the water.
BACKGROUND: Sometimes it is easy to tell if a stream is polluted. Strange colors and dead fish are often indicators of poor water quality, but biologists need to know about water quality problems long before they reach this point. Some of their most effective partners in detecting declining trends in water quality are aquatic macroinvertebrates because they respond rapidly to changes in water quality.
To evaluate the health and productivity of a stream, biologists look at the types of macroinvertebrate species who live there. Different species have different tolerance levels to pollution. If many pollution-intolerant organisms, such as stonefly or caddisfly nymphs, are present, the water quality is probably good. Although the presence of certain species indicates good water quality, the absence of these species does not necessarily indicate bad water quality. Other factors besides pollution may account for their absence.
Sensitive or Intolerant Species:
Organisms easily killed, impaired, or driven off by bad water quality; includes many types of stonefly, dobsonfly, and mayfly nymphs and caddisfly larvae.
Somewhat Tolerant Species:
Organisms with the ability to live under varying conditions may be found in good or poor quality water; includes amphipods, scuds, beetle and cranefly larvae, crayfish, and dragonfly nymphs.
Tolerant Species:
Organisms capable of withstanding poor water quality; includes most leeches, aquatic worms, midge larvae, and sow bugs.
PROCEDURE:
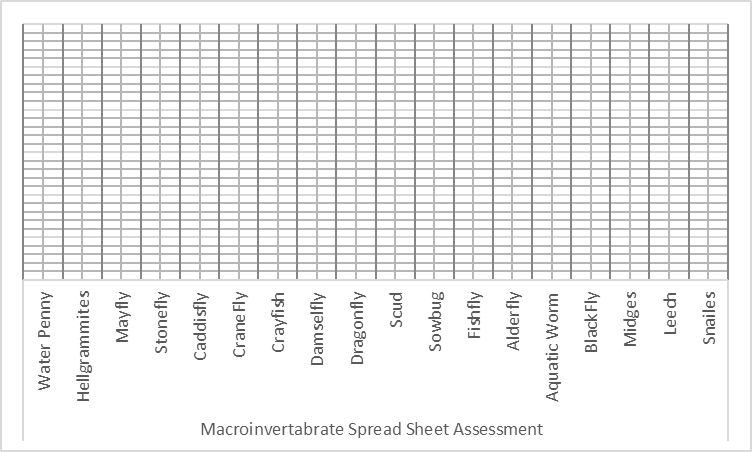
- Distribute graph paper to each student. Have students set up a bar graph for the aquatic macroinvertebrate sample. Label the x-axis with the names of the macroinvertebrates. Label the y-axis with the number of macroinvertebrates. You can also make copies of the graph below to hand out to the students.
- Using the Macroinvertebrate Talley Sheet Have the students count the number of each species of macroinvertebrate and graph them on the paper. Have the students try to determine the quality of the water.
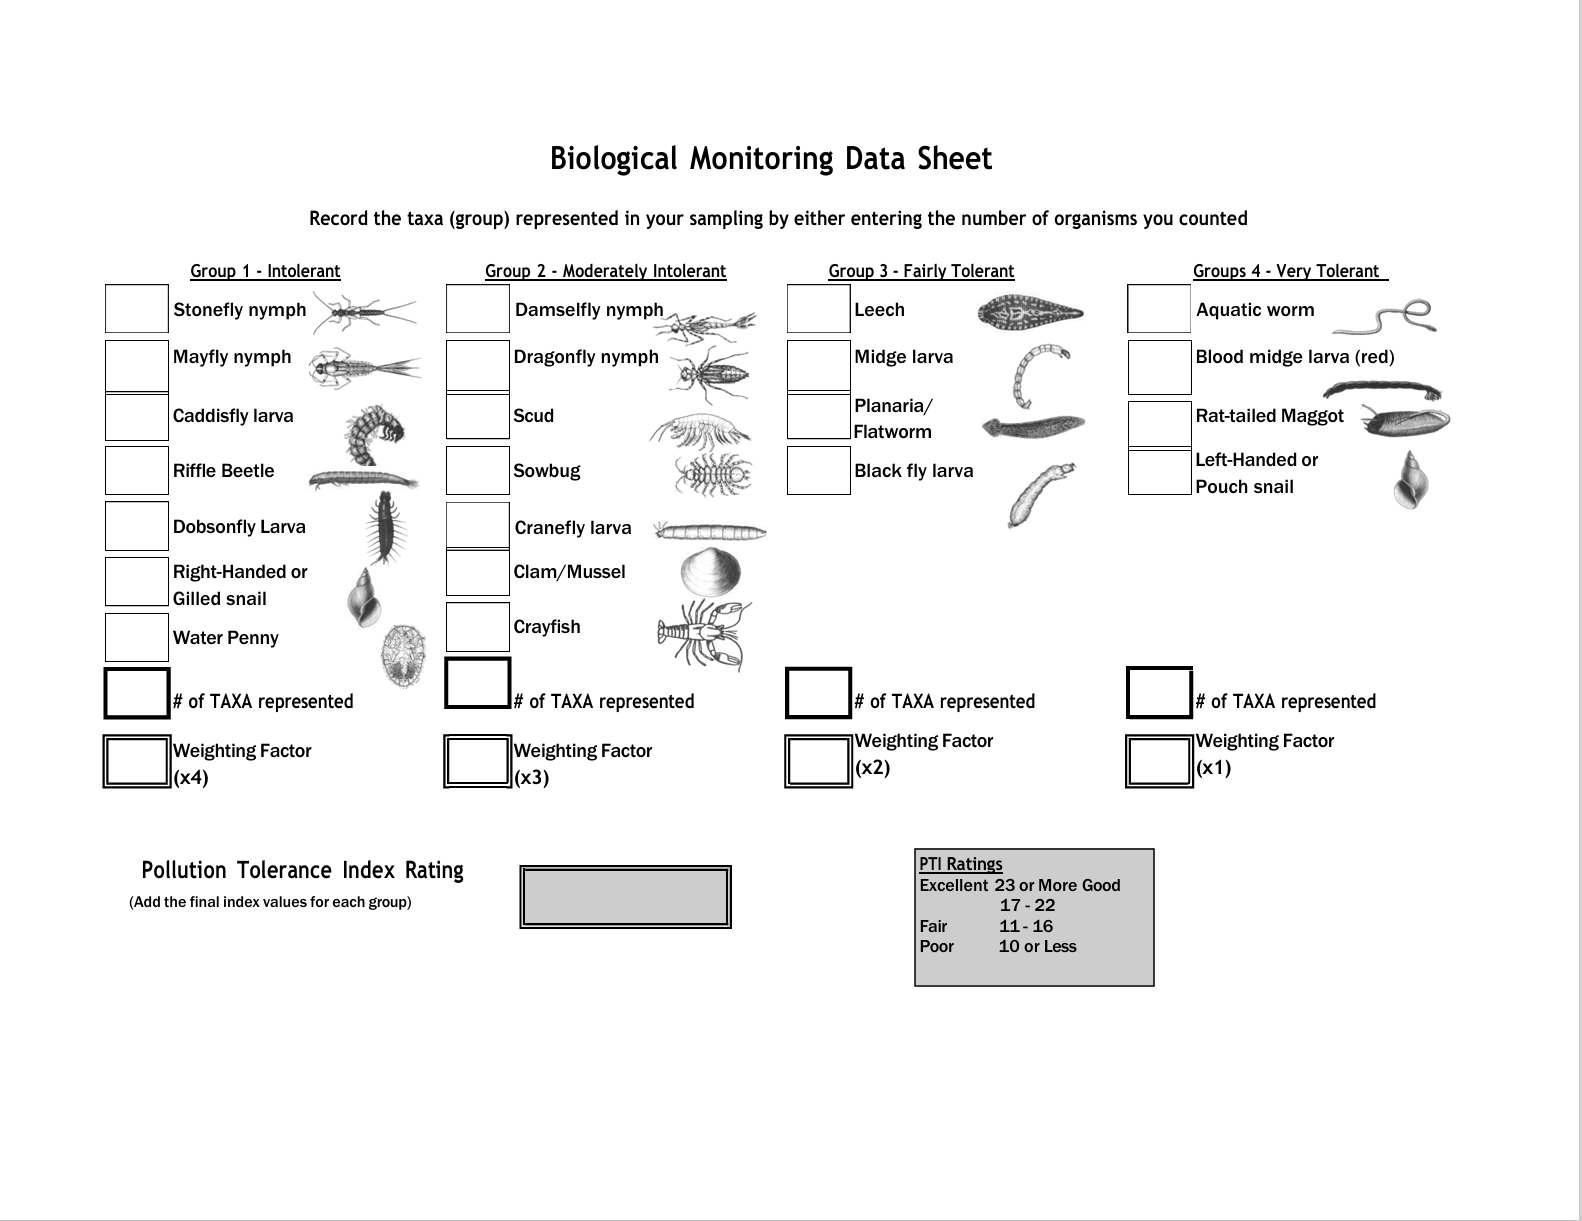
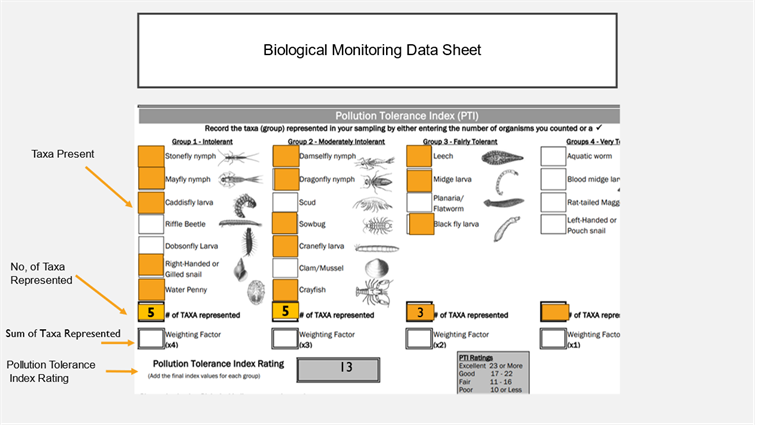
Use the Pollution tolerance Index to compute the Pollution Tolerance Indices for the stream.
- Enter the number of individuals for that Taxa in the box adjacent to the organism.
- Enter the number of Taxa represented in each sensitivity group in the box titled #of Taxa Represented.
- Sum the number of Taxa represented in each category, and enter that value in the Pollution Tolerance Index Rating box.